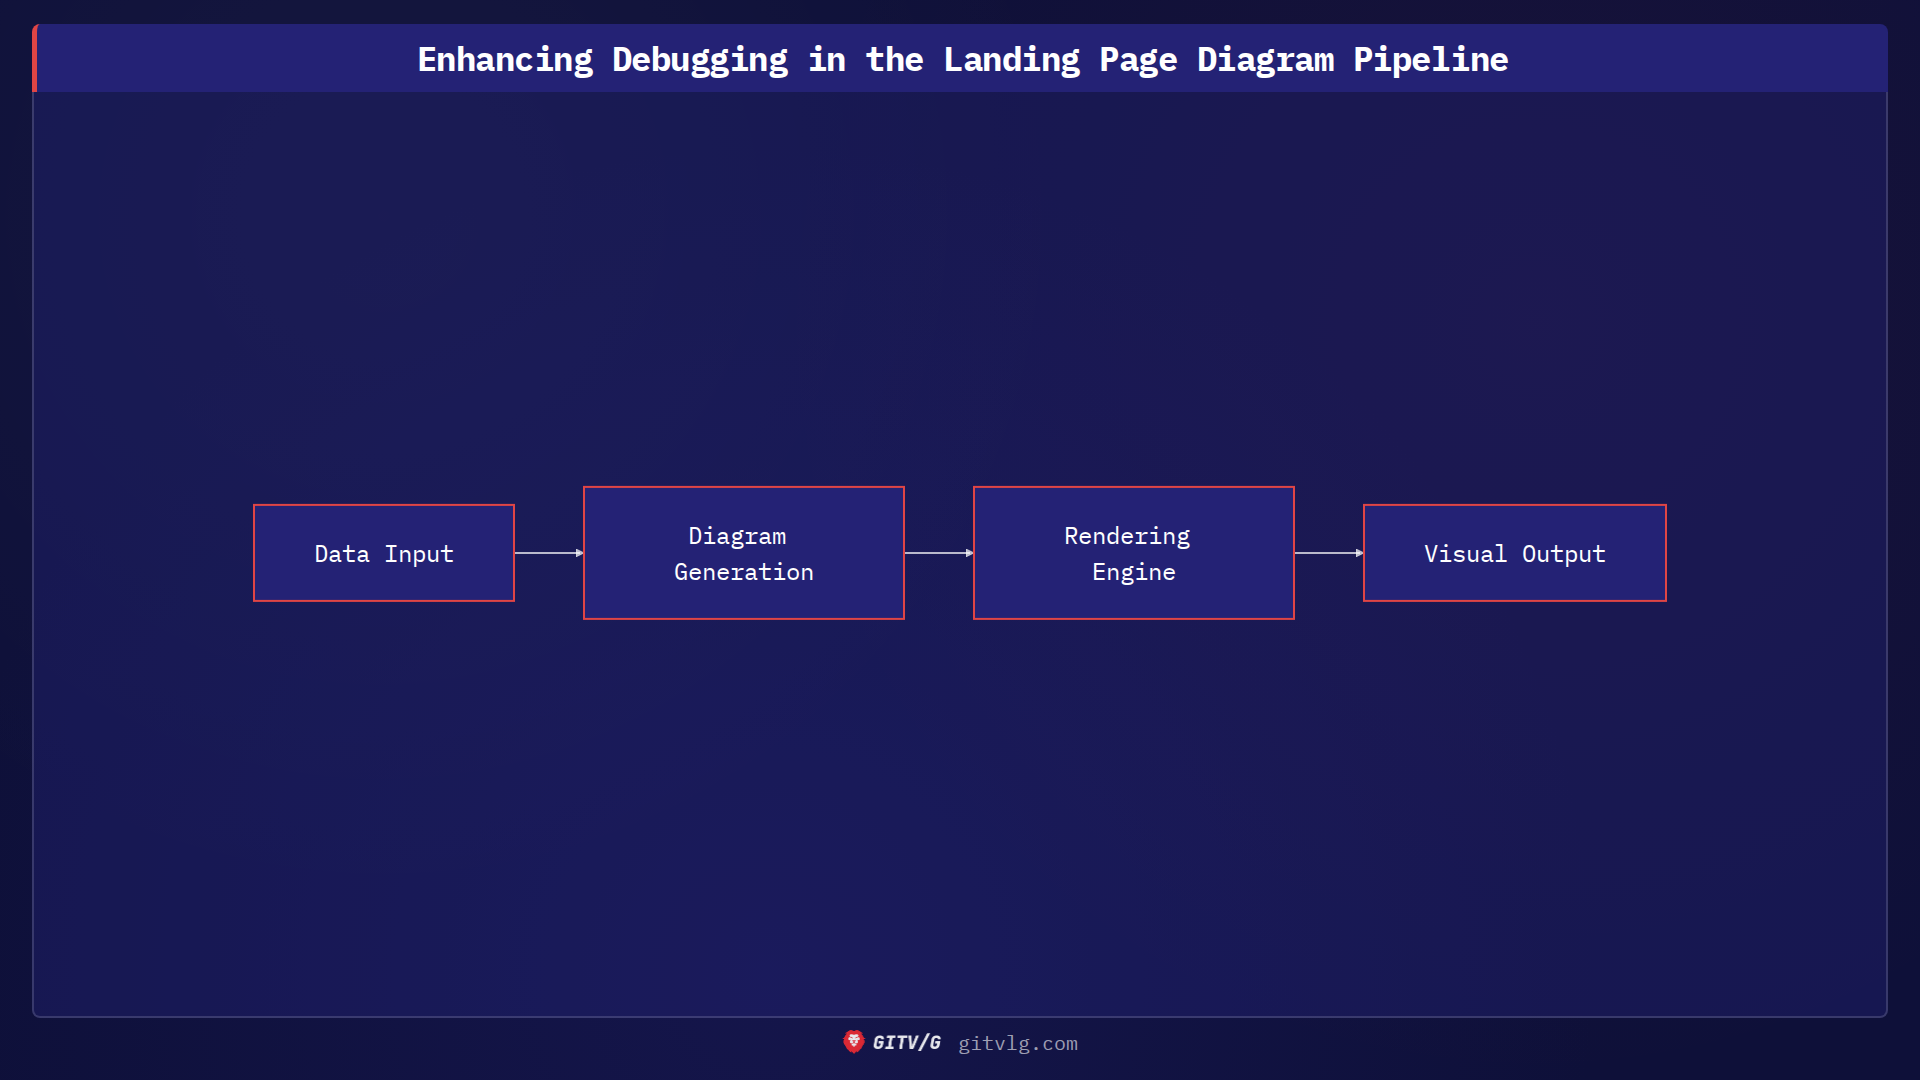
Enhancing Debugging in the Landing Page Diagram Pipeline
Introduction
In the ongoing development of the landing page for the devlog-ist project, we've recently focused on improving our debugging capabilities, particularly around the diagram generation and rendering pipeline.
The Challenge
Generating and rendering diagrams, while powerful, can be opaque. Identifying the source of errors or unexpected behavior in the diagram pipeline was proving difficult, slowing down development.
The Solution
We've added debug logging to the diagram generation and rendering pipeline. This additional logging provides detailed information about each step in the process, allowing for quicker identification and resolution of issues.
class DiagramService
{
    public function generateDiagram(array $data): string
    {
        Log::debug('Starting diagram generation', $data);
        $diagram = $this->buildDiagram($data);
        Log::debug('Diagram generated', ['diagram' => $diagram]);
        return $diagram;
    }

    private function buildDiagram(array $data): string
    {
        $nodes = $data['nodes'] ?? [];
        $edges = $data['edges'] ?? [];
        $diagram = "graph LR\n";
        foreach ($nodes as $node) {
            $diagram .= $node['id'] . "[\"" . $node['label'] . "\"]\n";
        }
        foreach ($edges as $edge) {
            $diagram .= $edge['from'] . " --> " . $edge['to'] . "\n";
        }
        return $diagram;
    }
}
Key Decisions
- Granular Logging: Log messages were added at the start and end of key functions in the diagram pipeline.
- Contextual Data: Each log message includes relevant data to provide context, such as input parameters and generated diagram code.
Results
These changes have significantly improved our ability to debug the diagram generation and rendering process. We can now quickly pinpoint the source of errors and resolve them, leading to faster development cycles.
Lessons Learned
Proactive debugging measures, such as detailed logging, can save significant time and effort in the long run. Investing in debugging tools and techniques early in the development process can greatly improve developer productivity.
